Menu
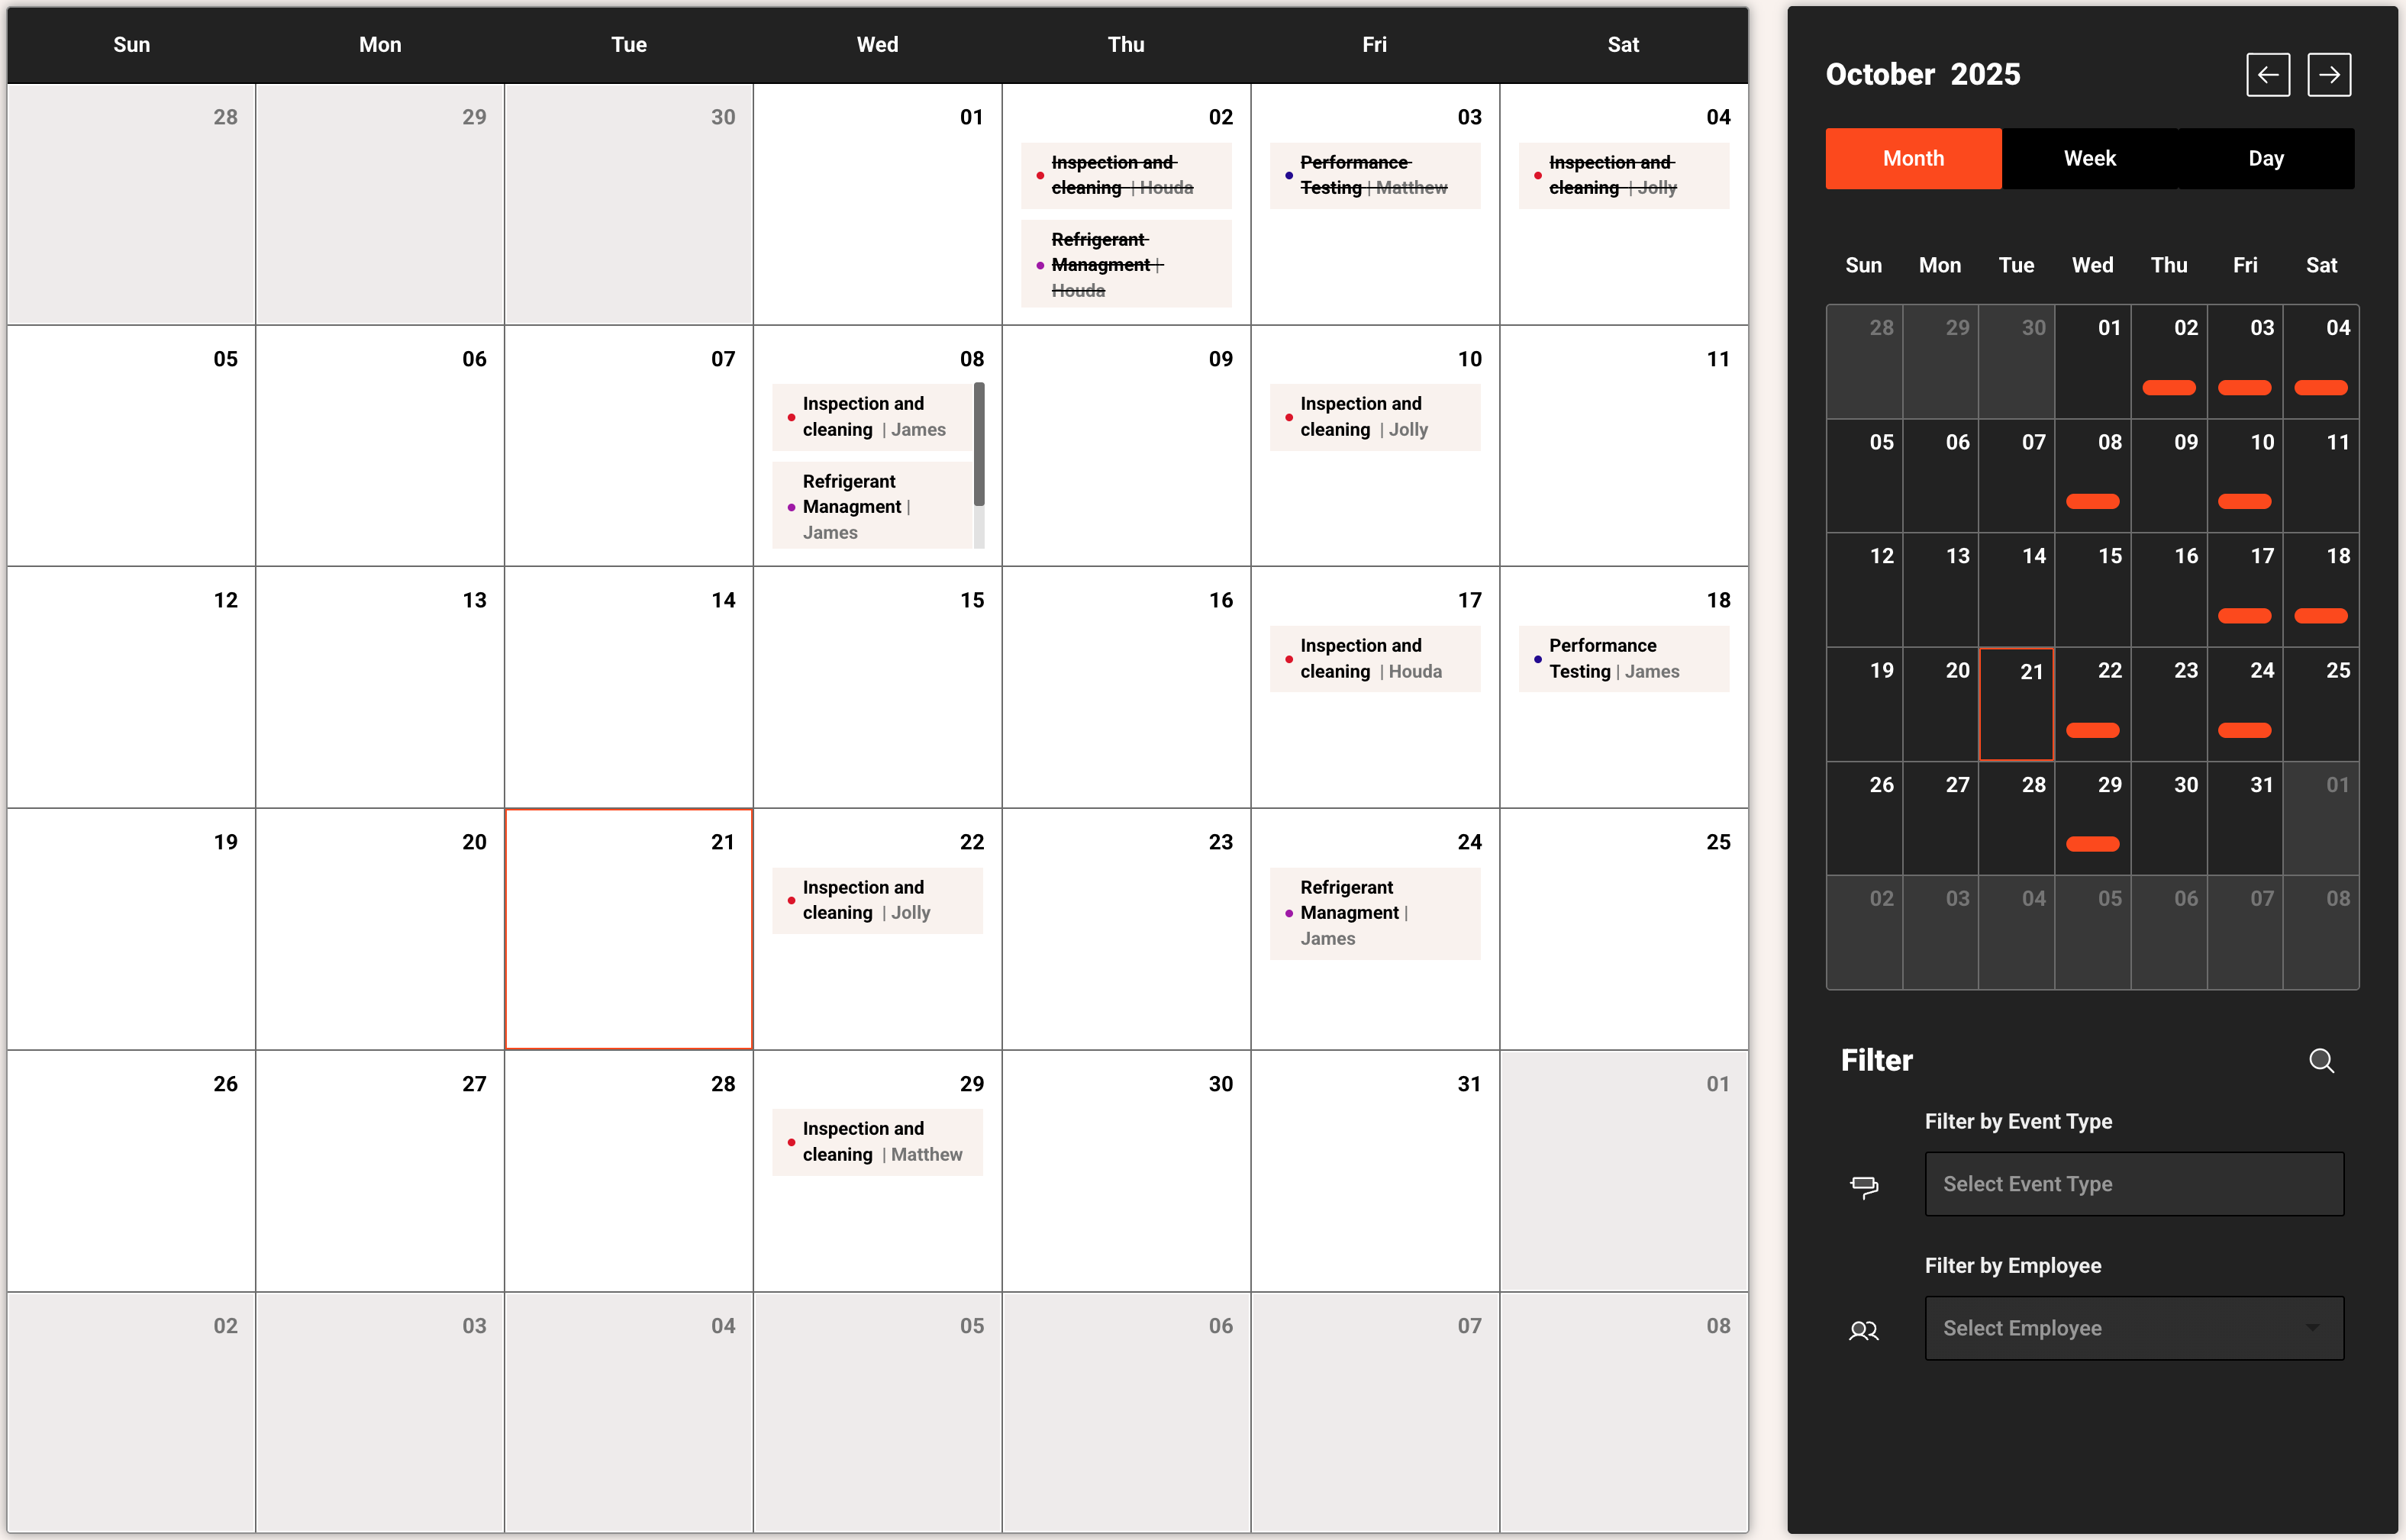
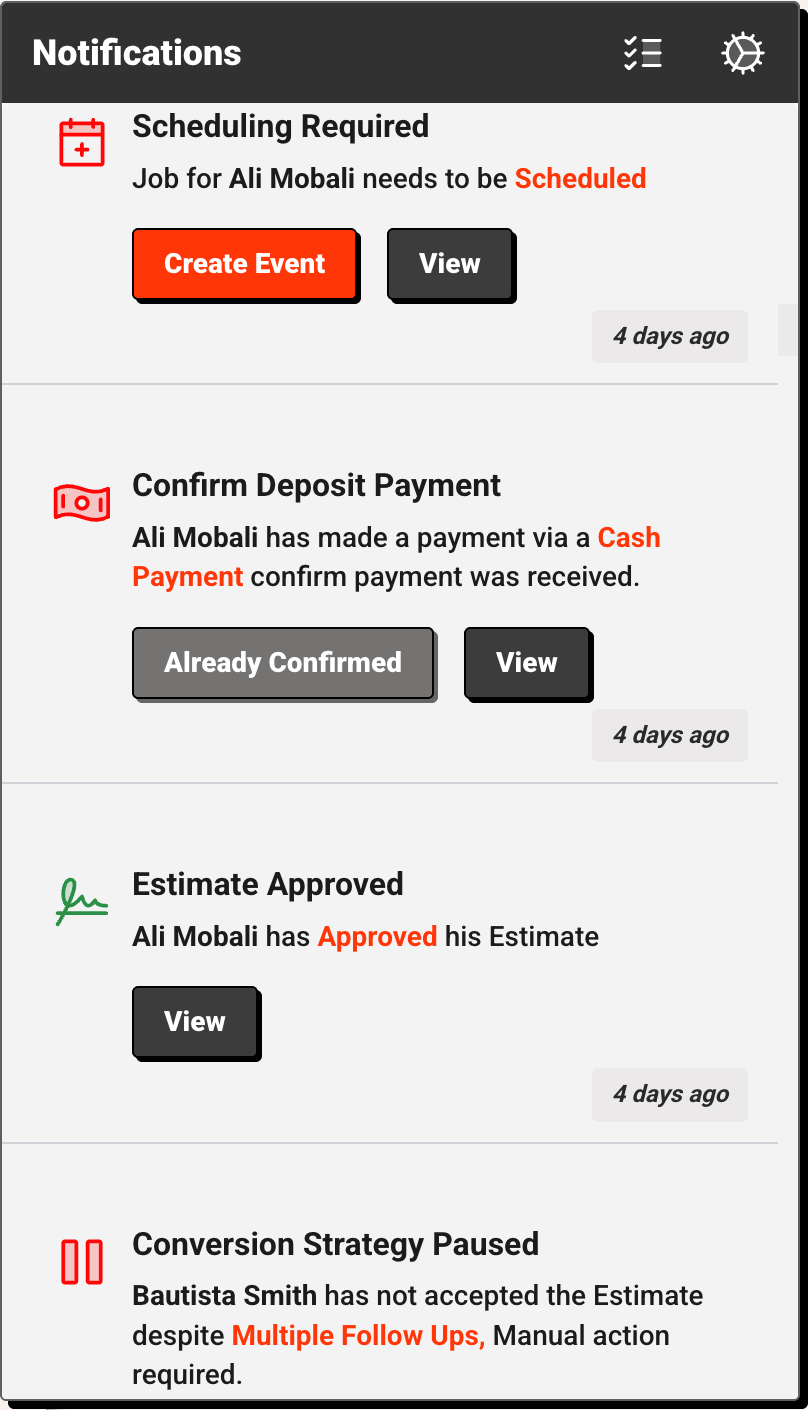
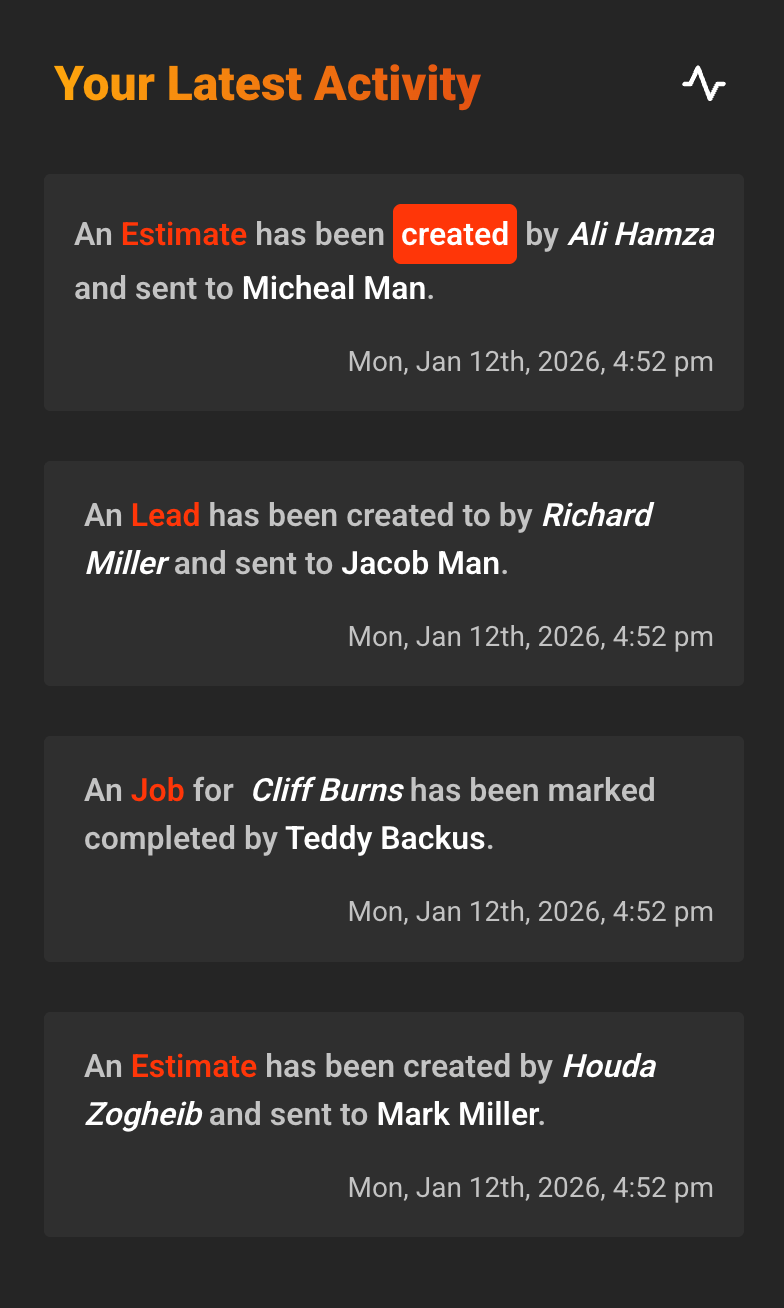
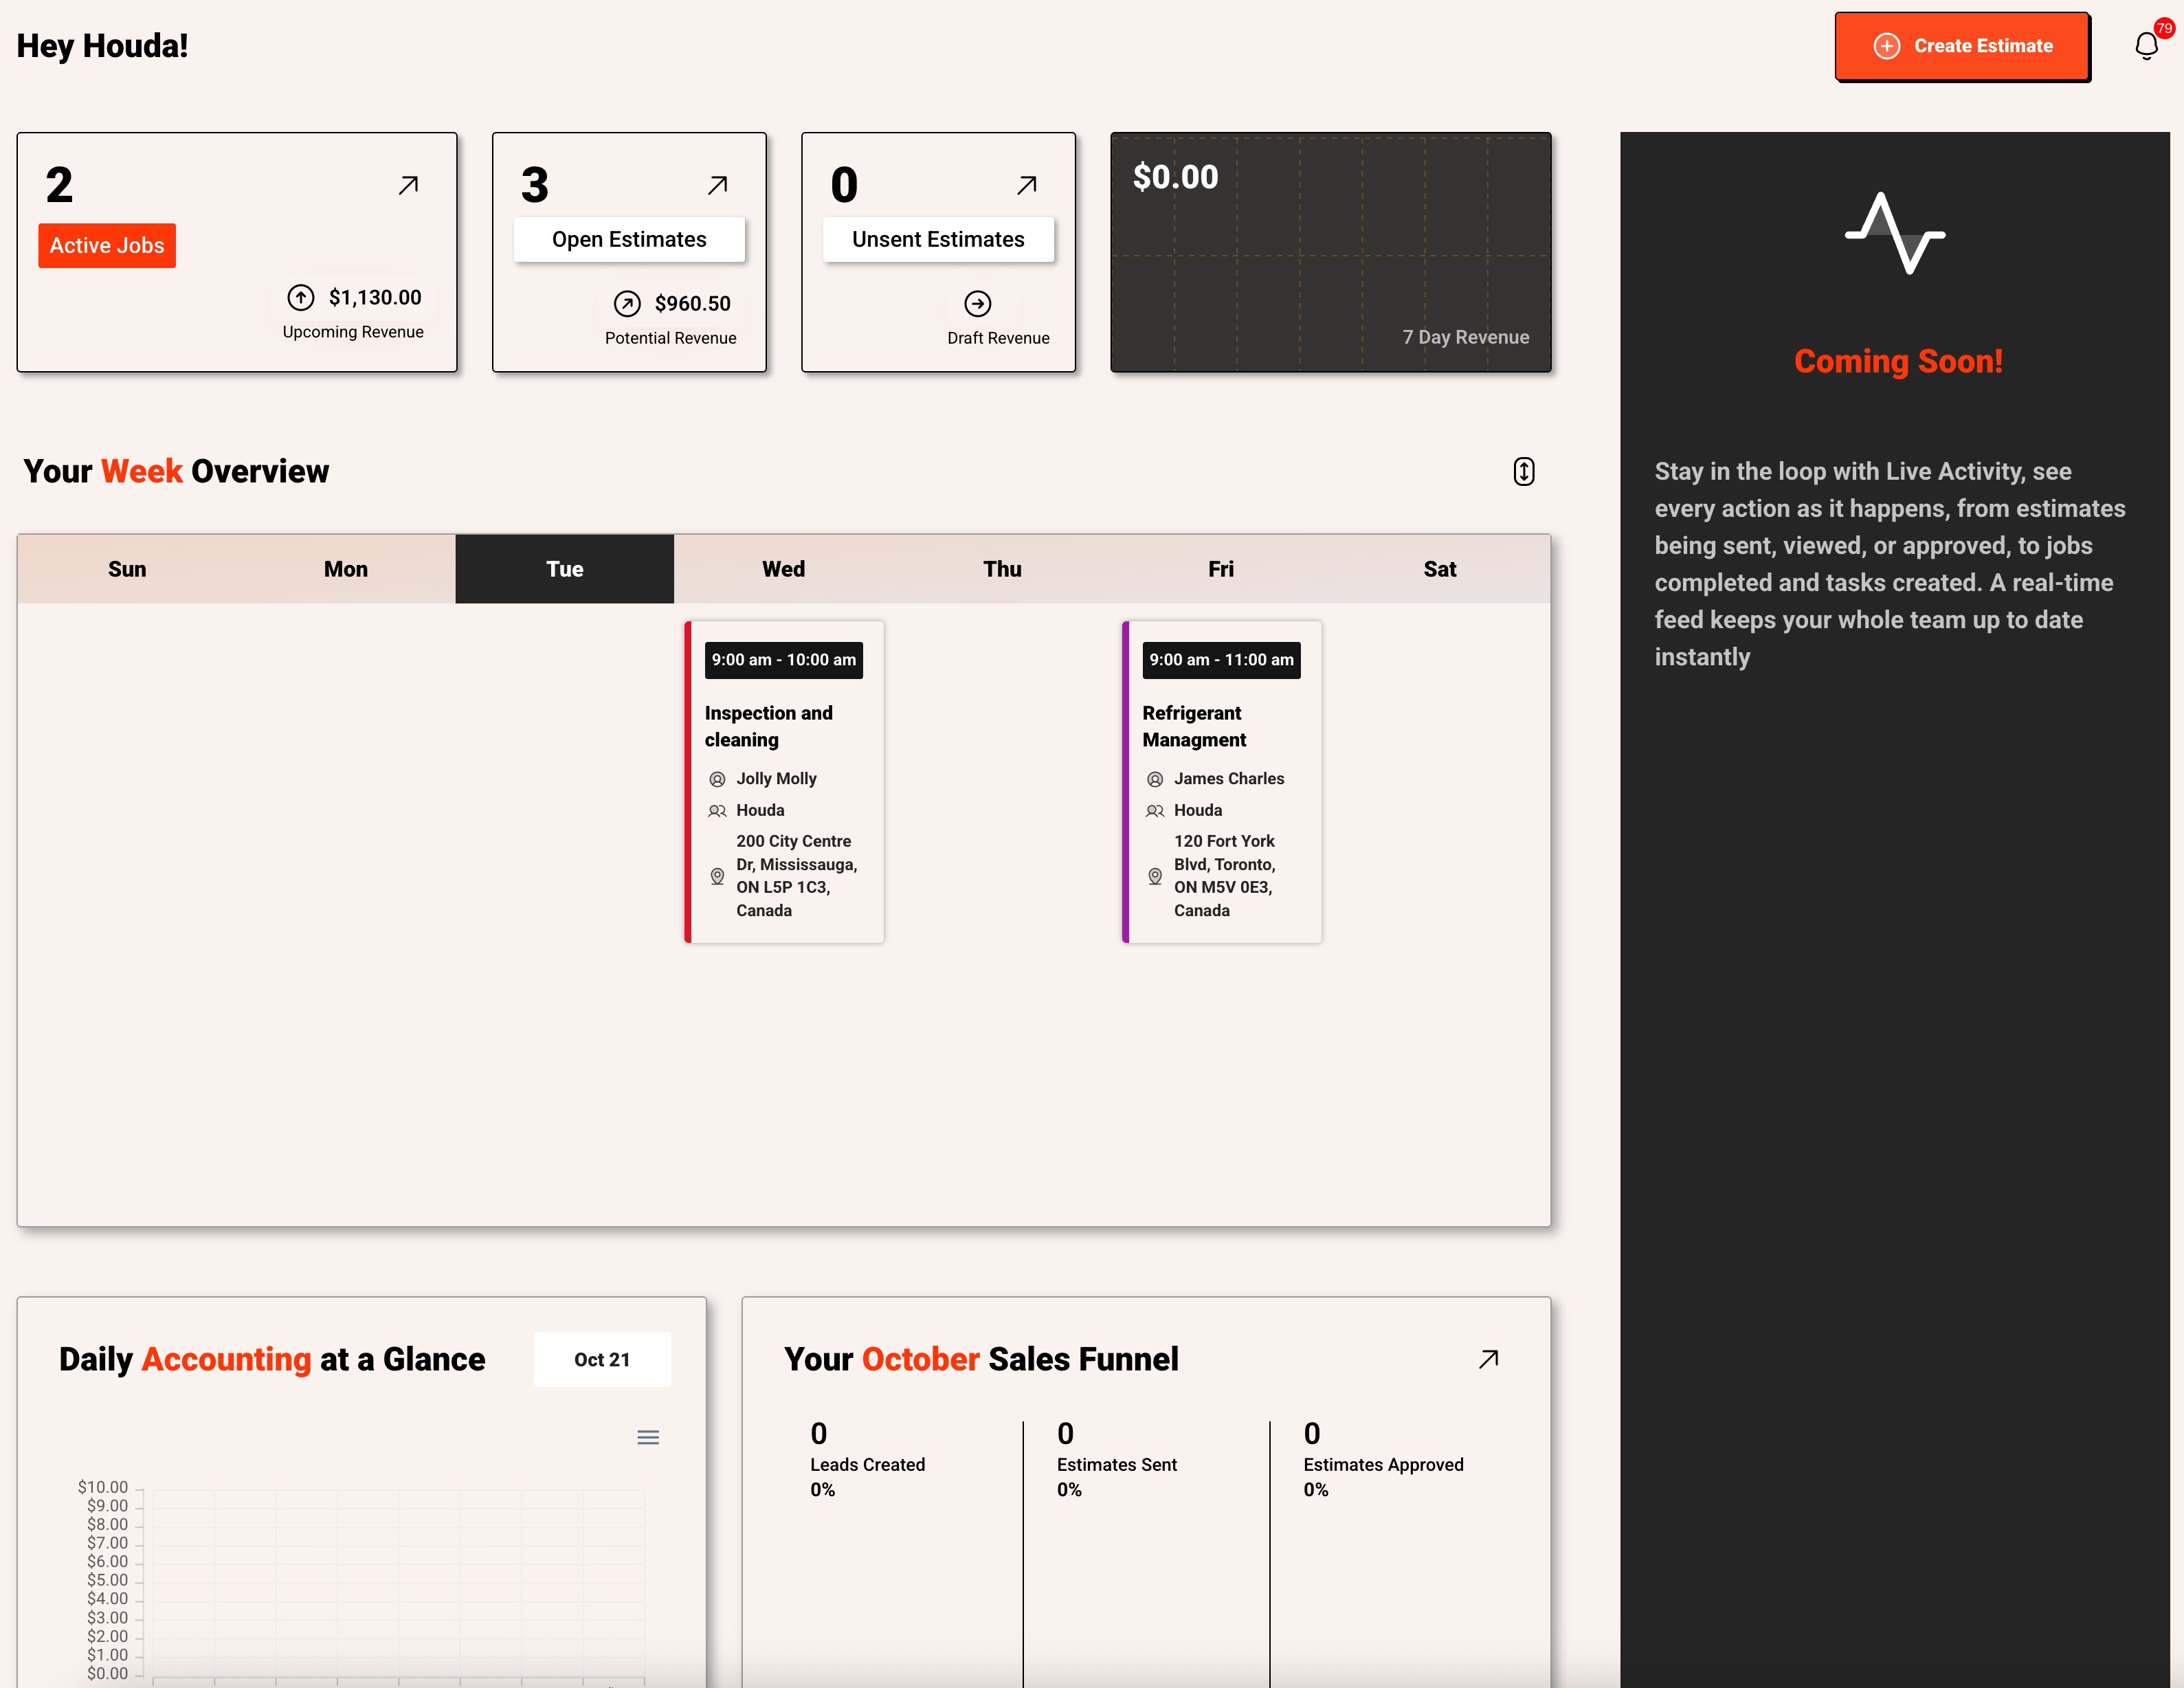
We’ve updated the Dashboard with a fresh new look designed to make navigation easier and more intuitive. You can now track key analytics at a glance, including revenue for the past 7 days through a clear graph, daily accounting, and your monthly sales funnel. The Dashboard also gives you a full-week view of events, along with an overview of how many jobs are currently active, how many estimates are open, and how many haven’t been sent yet. These improvements give you a complete snapshot of your business in one place, making it easier to stay on top of operations.
Popular Frameworks to Get Started:
How to Apply Frameworks in Your Day-to-Day Workflow